

Dataflow Across Pipeline Stages#
Stage 3 Dataflow#
At the highest level we have the following in the context of pipeline stages 2-4:

The Raw Output Data files from experimental runs are processed during stage 3 into Processed Output Data files. In stage 4 those processed files are turned into products of various sorts. All stage 4 products are sourced from a single data file, to encourage and enable reusability of code across projects. As such, it is the job of active stage 3 plugins to make sure all the data needed to generate a given product appear in the same file. The process of doing this is called Data Collation.
Important
Stage 3 operates at the level of Raw Output Data files and Experimental Runs, while stage 4 operates at the level of Collated Output Data files, Processed Output Data files and Experiments.
With that framing in mind, we can dive into the dataflow in detail.
Intra-Experiment Dataflow#
Within stage 3 the first type of data processing that occurs is intra-experiment data processing. If we look at the data from stage 2 for a single Experimental Run \(j\) from Experiment \(i\) in Batch Experiment which produces \(k\) raw output files, we could represent the output data abstractly as:
![@startuml
!theme plain
!include sierra-palette.iuml
skinparam defaultTextAlignment center
left to right direction
skinparam DefaultFontSize $FONT_BODY
skinparam stateFontStyle bold
hide empty description
' One run's k raw output files. Color = file INDEX (0,1,...,k).
state "run j" as runj $FILEBOX {
state "file 0" as filej0 $COL_0
state "file 1" as filej1 $COL_1
state "..." as filejx $DEEMPHASIS
state "file k" as filejk $COL_B
filej0 -[hidden]r-> filej1
filej0 -[hidden]d-> filejx
filej1 -[hidden]d-> filejk
filejx -[hidden]r-> filejk
}
@enduml](../../_images/plantuml-1bda232177ad6299c57a81ea557b2cb7968ed976.png)
For intra-experiment data processing, all of the per-run outputs are matched
across Experimental Runs within an
Experiment, and processed in some way (e.g., generating
statistical distributions). Crucially, the processing
is done at the level of entire files (i.e., it is a file-level reduce
operation). For example, if runs produce a foo.csv file, then every column
in foo.csv will be present in the corresponding Processed Output
Data files as well.
This can be visualized as follows:
![@startuml
!theme plain
!include sierra-palette.iuml
skinparam defaultTextAlignment center
skinparam DefaultFontSize $FONT_BODY
skinparam stateFontStyle bold
hide empty description
' Per-run raw output files reduced into a single processed-outputs file.
' Color = file INDEX (0,1,...,k), traced positionally across the reduce.
state "run 0" as run0 $FILEBOX {
state "file 0" as file00 $COL_0
state "file 1" as file01 $COL_1
state "..." as file0x $DEEMPHASIS
state "file k" as file0k $COL_B
file00 -[hidden]r-> file01
file00 -[hidden]d-> file0x
file01 -[hidden]d-> file0k
file0x -[hidden]r-> file0k
}
state "run 1" as run1 $FILEBOX {
state "file 0" as file10 $COL_0
state "file 1" as file11 $COL_1
state "..." as file1x $DEEMPHASIS
state "file k" as file1k $COL_B
file10 -[hidden]r-> file11
file10 -[hidden]d-> file1x
file11 -[hidden]d-> file1k
file1x -[hidden]r-> file1k
}
state "..." as runx $DEEMPHASIS
state "run j" as runj $FILEBOX {
state "file 0" as filej0 $COL_0
state "file 1" as filej1 $COL_1
state "..." as filejx $DEEMPHASIS
state "file k" as filejk $COL_B
filej0 -[hidden]r-> filej1
filej0 -[hidden]d-> filejx
filej1 -[hidden]d-> filejk
filejx -[hidden]r-> filejk
}
state "Processed outputs" as intra $ROLE_OUTPUT {
state "file 0" as filep0 $COL_0
state "file 1" as filep1 $COL_1
state "..." as filepx $DEEMPHASIS
state "file k" as filepk $COL_B
filep0 -[hidden]r-> filep1
filep1 -[hidden]r-> filepx
filepx -[hidden]r-> filepk
}
run0 -[hidden]r-> run1
run1 -[hidden]r-> runx
runx -[hidden]r-> runj
run0 -d-> intra
run1 -d-> intra
runx -d-> intra
runj -d-> intra
@enduml](../../_images/plantuml-84ee8541c288194329257d342f0c126a1afba0cd.png)
Some examples of plugins performing this reduce operation:
Inter-Experiment Dataflow#
Within stage 3 the second type of data processing that occurs is inter-experiment data processing. If we look at the data from stage 2 for a single Experimental Run \(j\) from Experiment \(i\) in Batch Experiment which produces \(k\) raw output files, we could represent the output data abstractly as follows, using Experimental Run as SCOPE:
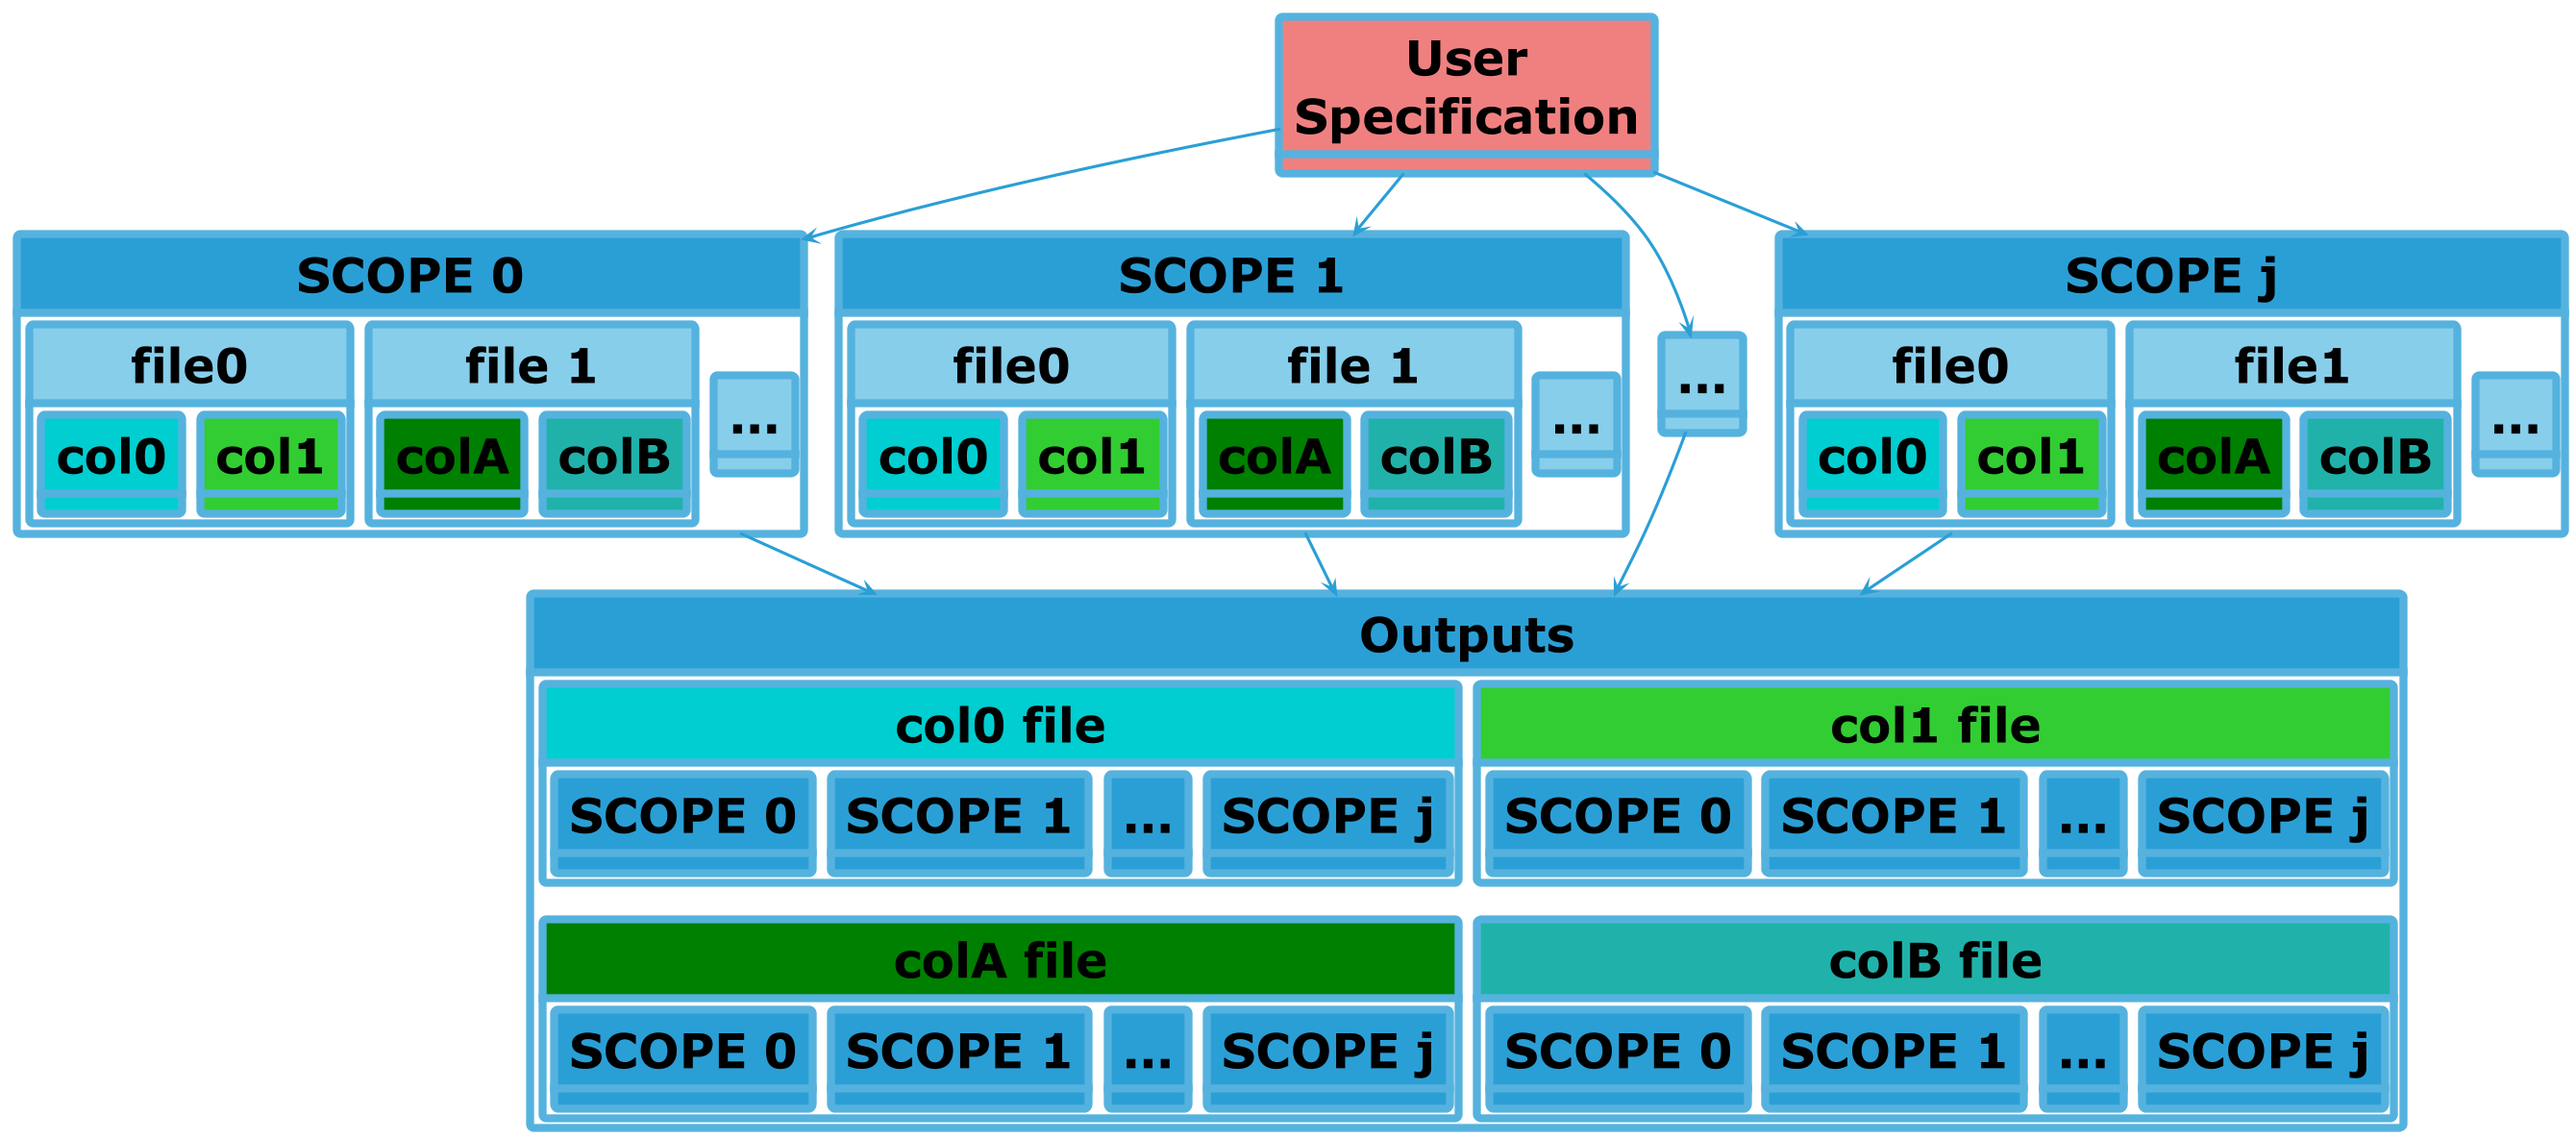
Each collated output above is drawn from a single source file. A collated output can instead draw its columns from several source files, joined together per run before collation -- useful when the columns needed for one product live in different raw output files. In that case each run contributes a joined group of columns to the single collated output:
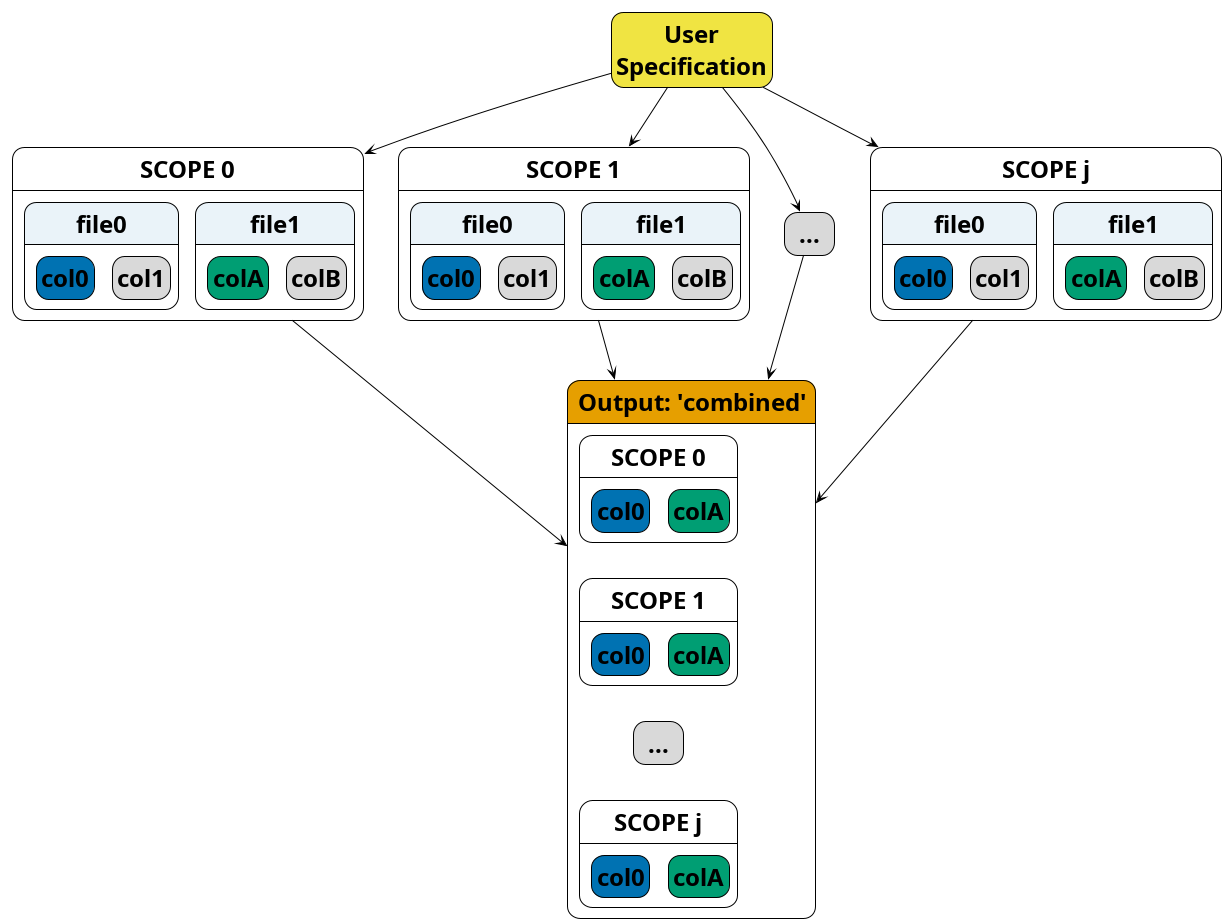
Either way, the result is a single collated file per output, which is what stage 4 consumes: the multi-file joining happens here, in stage 3, so that stage 4 products remain sourced from a single file. See Intra-Experiment Data Collation for the configuration.
An important point here is that within the SIERRA builtin stage3 processing
plugins not all raw output files get processed in this manner, only those which
are going to be used during stage 4 to produce something via a
user-specification. Generally this means that there is a .yaml file in a
Project somewhere which has a list of Products which a
user wants to generate. This list is matched against the raw output files, and
only matching files are processed. Thus, SIERRA is very efficient in its data
processing.
Note
This matching is exact: a configured source name is matched against a raw output file's path relative to the run output root (not a substring of it), so a bare name resolves at the output root and a nested file must be named by its path. A name that matches more than one file is a hard error.
Tip
Processed Output Data files can be thought of as time-series data at the level of Experimental Runs.
Some examples of plugins performing this collation:
Stage 4 Dataflow#
At the highest level we have the following in the context of pipeline stages 3-5:

After Stage 3 Dataflow, data is in Processed Output Data files and/or Collated Output Data files. In stage 4, the Processed Output Data files can be taken and directly converted to products along one of two paths using appropriate plugins:
Intra-experiment products such as graphs and videos, which are built from a single processed output data file.
Inter-experiment products such as graphs, which are built by joining together identical sections/slices of the processed output data files for a single experiment.
Like the stage3 dataflow, generally in stage4 things are file-level.
Intra-Experiment Dataflow#
![@startuml
!theme plain
!include sierra-palette.iuml
skinparam defaultTextAlignment center
skinparam DefaultFontSize $FONT_BODY
skinparam stateFontStyle bold
hide empty description
' 1:1 mapping: each processed-outputs file becomes one product.
' Color = item INDEX, traced across the map.
state "Processed Experiment\nOutputs" as proc $ROLE_OUTPUT {
state "file 0" as filep0 $COL_0
state "file 1" as filep1 $COL_1
state "..." as filepx $DEEMPHASIS
state "file k" as filepk $COL_B
filepx -[hidden]r-> filepk
filep1 -[hidden]r-> filepx
filep0 -[hidden]r-> filep1
}
state "Intra-Experiment\nProducts" as prod $ROLE_OUTPUT {
state "product 0" as productp0 $COL_0
state "product 1" as productp1 $COL_1
state "..." as productpx $DEEMPHASIS
state "product k" as productpk $COL_B
productpx -[hidden]r-> productpk
productp1 -[hidden]r-> productpx
productp0 -[hidden]r-> productp1
}
filep0 --> productp0
filep1 --> productp1
filepk --> productpk
filepx --> productpx
@enduml](../../_images/plantuml-6f9bd174a2eac3769b021ca7ae89402f437c2b4f.png)
There isn't really any dataflow for intra-experiment products, because there is a 1:1 mapping between the Processed Output Data file and the Product: all the data needed to generate a given product is within a single file.
Inter-Experiment Dataflow#
Inter-experiment processing in stage4 is Data Collation, but this time at the level of Experiments rather than the Experimental Runs:
This process in stage 4 can be visualized as follows for a single
Batch Experiment, using Experiment as SCOPE. Input files in this
case are Processed Output Data -- one file per experiment, named by a
single src -- and the output is a single Collated Output Data
file. Note the shape: unlike the stage-3 picture above (one output file per
column, cells per run), here a single configured column is taken from each
experiment and becomes one column per experiment in a single output file. It
is, in effect, the transpose of the stage-3 collation.

Each output file is a summary of a batch experiment along some axis of interest. Once processed, products can be generated directly from the inter-experiment files with a 1:1 mapping as above.
Stage 5 Inter-Batch Dataflow#
After Stage 4 Dataflow, data is in Processed Output Data
files and/or Collated Output Data files. In stage 5, the Collated
Output Data files can be taken and further collated to create
Inter-Batch Data files. The dataflow for this can be visualized as
follows, with Batch Experiment as SCOPE -- e.g. comparing several
controllers, or one controller across several scenarios. Each compared SCOPE
contributes its per-experiment collated series, and these are placed
side by side as one column per SCOPE (indexed by Experiment ID) in a
single output file, ready to be plotted together.

Each output file is a summary of a set of batch experiments along some axis of interest.#